In the event of a road collision involving at least one vehicle and one injury, there is a requirement in the UK to report to the police within 30 days. The data are called “STATs19” after the form on which the data are collected, and are made available as “Open Data” for anyone to analyse.
This immediately raises a number of points:
- What is a “road” collision (do car parks, driveways, private roads count)?
- What is an “injury”? More specifically, injury severity is coded by the police, with no medical input, as Fatal, Serious or Slight. What is the difference between “Serious” and “Slight” and how robust is this coding system. Fatal means anyone who dies within 30 days from their injuries.
- What is a vehicle (bicycles are included, but what about scooters - powered and un-powered)? More importantly, how well is this understood by those with a duty to report (the public) and those with a duty to record (the police)
- What is the police role when an injury collision is reported? Are they looking to see whether any offences have been committed or are they carrying out an in-depth investigation as to what factors may have lead to the collision? There are more detailed investigations for fatal and potentially fatal collisions, but the findings from these (e.g., coroners information on blood alcohol) are not necessarily passed on to the STATs19 data.
In other words, when we analyse these STATs19 data we are not analysing road collisions. We are analysing an administrative process; police records of collisions which were reported to them. There is a huge gulf between the real world and these records. This does not imply malfeance; it is an inevitable result of any attempt to quantify the real world.
## `summarise()` has grouped output by 'yw'. You can override using the `.groups`
## argument.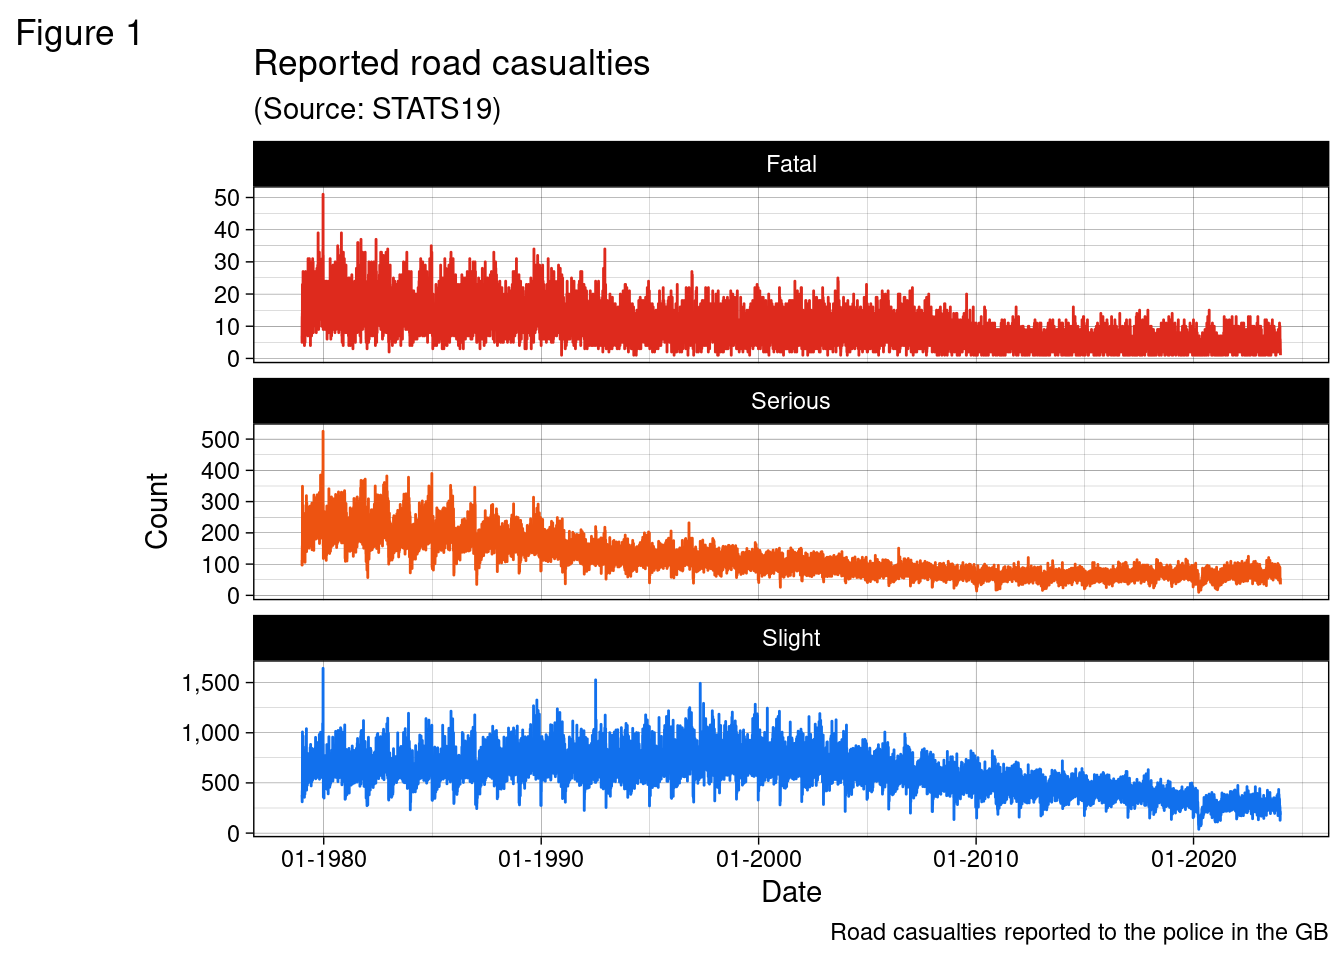
A few things are clear from Figure 1.
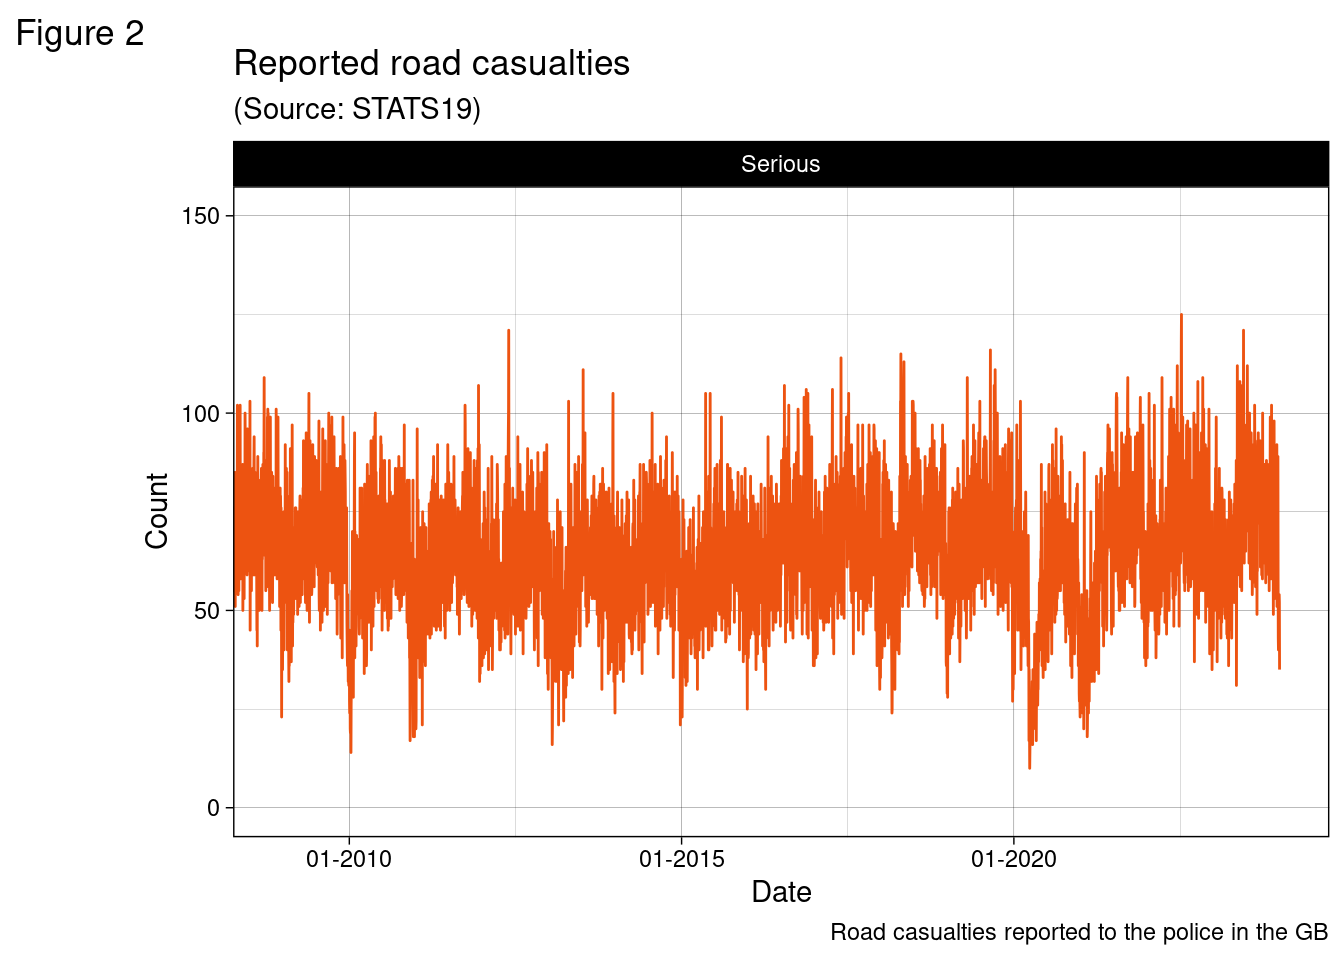
- There has been a general decline in the number of casualties over the four decades (with one exception, we will zoom on Serious collisions in Figure 2).
- There is day by day variation in the number of casualties (again, when we zoom in on Figure 2 it becomes very clear that there are annual seasonal trends that seem fairly regular).
- But interestingly, when we zoom in on serious casualties, we can see that the underlying trend seems to change in 2013; there seems to have been an increase in reported serious casualties overall since 2013.
So, an obvious question is what is happening and why. A decrease in casualties sounds like a good thing; however if this is happening because less people are walking and cycling this is not a good thing - the health disbenefits from an inactive lifestyle might be more important than the lifes saved through injury reduction. It does however seem likely that road design standards have gradually improved since 1979 and certainly car safety has improved - from compulsory seat belt wearing through to air bags and safer cars. All of which sounds entirely reasonable, but begs the question: why has the number of seriously injured casualties been increasing since 2013. And there are many possible explanations:
- Due to increased automobile safety, less people are being killed in car crashes being seriously injured instead
- There was a decision made in 2013 to increase the quality processes around reporting injury severity, consequently many injuries that were previously reported as slight are now coded as serious
- As a result of austerity many more people are lift sharing (instead of taking a bus or train) and the number of casualties per collision has increased in cars.
- More people are reporting injury collisions
- There has been an increase in the number of people seriously injured as there has been an increase in the number of “vulnerable” road users (pedestrians and cyclists)
- With an aging population, we have people in cars who are more likely to incur a serious injury than a younger person who would only incur a slight injury
- Other: I am sure there are many other possibilities that could be considered.
And there we are. The data can’t tell us anything actionable. There is no clear insight we can develop from these data, as presented here.
We could rule some suggestions in or out with closer examination of the data. But some suggestions seem very difficult to explore. In part, this is always a problem with observational data, especially when those data are a byproduct of an administrative system. But the aim of this blog is to revise and explore these questions.
Use the share button below if you liked it.
It makes me smile, when I see it.