Developing context; the value of historical data
Developing context: visualising the age and cohort (birth year) of road traffic casualties along with the date of their injury
Thursday, 7 Jan, 2021 By Paul Hewson.

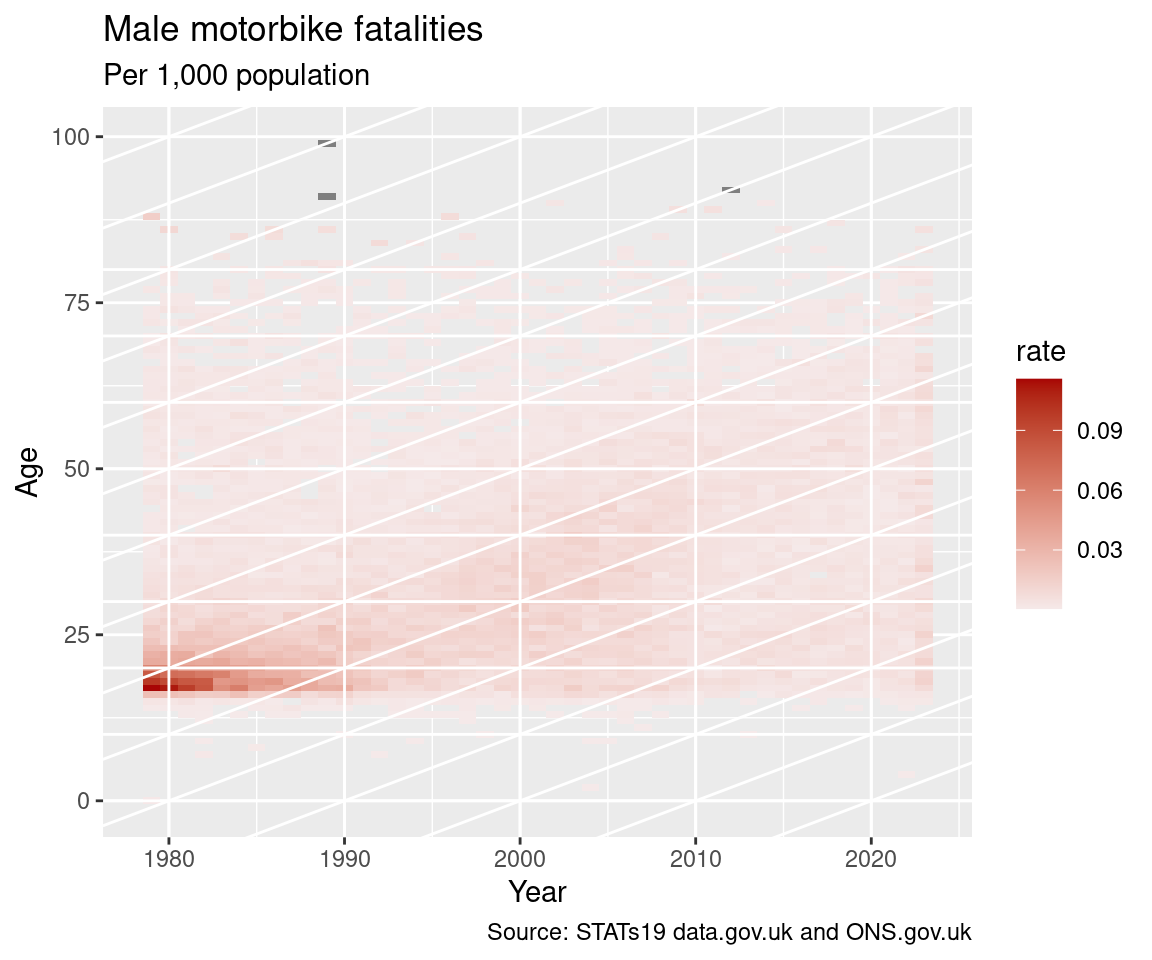
I believe that data makes little sense without context. Often, we are lacking adequate information on context. When researching disease, knowing the age and sex of the patients is almost always important. When considering road injury research, it is harder to arrive at such an understanding because firstly there are both drivers and casualties to consider, and secondly there may be more than one driver. One of the most substantial weaknesses in the official road safety collision data are that no information is collected on uninjured passengers in any of the vehicles involved. However, one simple way of adding context is to consider trends over time. The so-called lexis diagram; a heatmap of injury rate by age and year lets us consider the age of a casualty, as well as the date on which an injury occurred. But, we could draw diagonal lines across the graph showing the birth year of the casualties. Indeed, we can extend this even further to a so-called age-period-cohort model which permits even fuller consideration of the data. However, for now, two simple Lexis diagrams are presented. The first shows the male motorcycle fatality rate per 100,000 population. It is clear that in the early 1980s, the fatality rate for males around 20 year old was extremely high, approaching 50 per 100,000 or around 1 in 2,000 males in that age group killed in a motorcycle crash. Bear in mind that it seems unlikely that more than half the males in this age group rode a motorcycle this is an extremely high fatality rate.
The second most striking thing about this plot is the cohort effect. A clear diagonal boundary can be extending from these males (born in the 1960s) which only starts to fade after 2010 by which time they have reached the age of 50. This is informative data. In the 2000s, a widely held belief in the road safety practitioner community was that there were a lot of deaths among “born again bikers” in their 40s, who had money, done minimal training and bought ultra-powerful motorbikes. Clearly a simple Lexis diagram cannot speak directly to this theory, but it doesn’t look consistent with it. Where is the dip in the 1990s in fatality rate among 30 year old male motorcyclists. It looks as if the 1960s born males were always likely to ride a bike and at risk of a fatal collision. By the time they were in their 40s, it seems a cultural bias “they should have known better” might have lead to the “born again biker” narrative, rather than the rather duller explanation that this age group were just more likely to ride a bike.

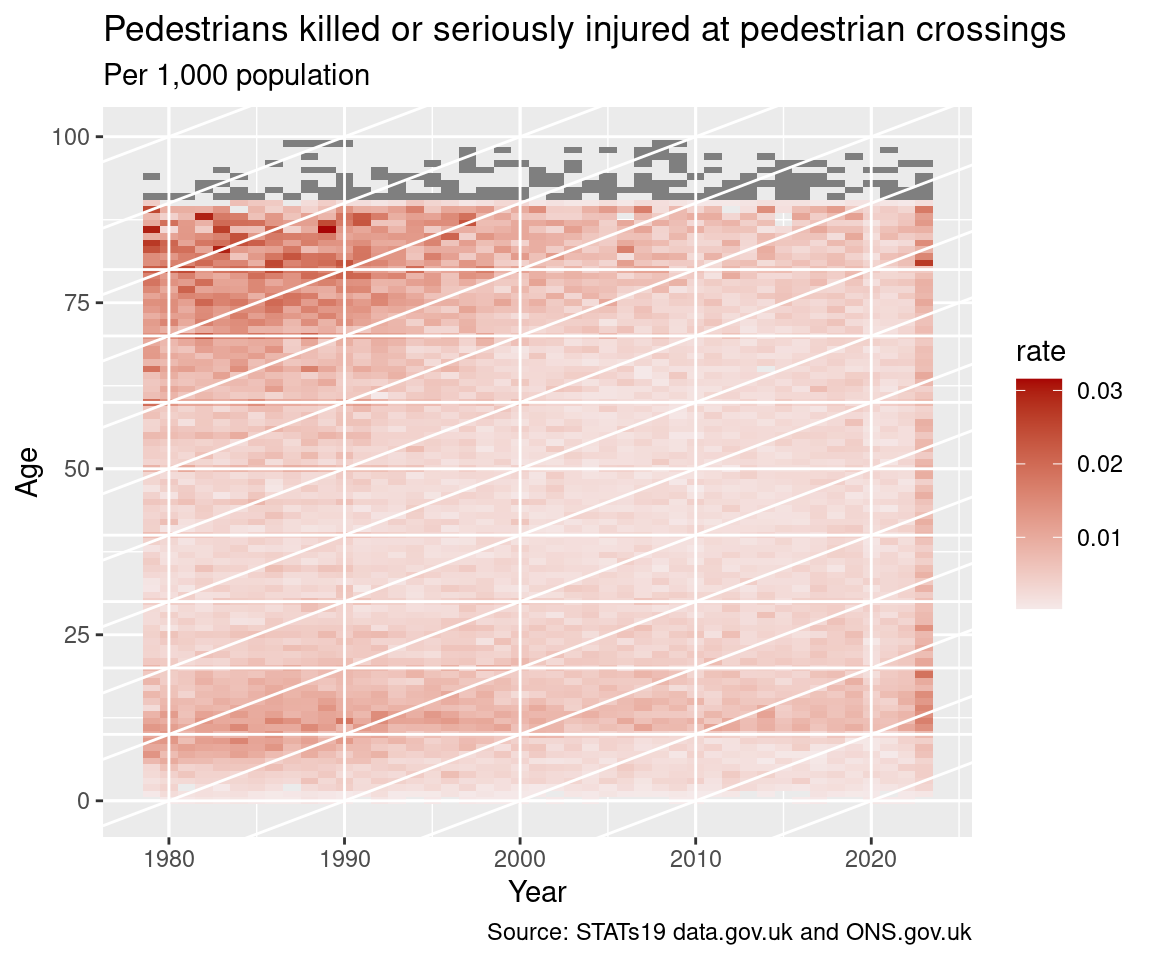
By way of a contrast, the second figure concerns the killed and seriously injured rate of males and females who were recorded injured as pedestrians at road crossings. There is no information on the presence of a road crossing prior to 1985 in the data. It appears there is a faint horizontal band (which narrows) consistent with secondary age pupils from 1985 to 2019. It appears broader at the start of the time horizon, and also note there are some faint blue squares. So the high injury rate seems to have lowered amongst younger children and teenagers. It is possible to claim that the rate has been increasing amongst older teenagers in the last few years.
Another striking feature of the plot is the high rates among older people in the late 1980s which has faded away. This raises lots of questions. Has there been a change in infrastructure, such as better provision of signalled crossings rather than zebra crossings? Or does this represent a bhavioural change, such as proportionately more older people using cars whereas previously they would have walked? Or might it be the case that older people are restricting their mobility for safety reasons?
There are two obvious follow ups to the points raised here. The first is to formally fit Age-Period-Cohort models. In the case of the motorcycle fatalities it will be of interest to examine the relationship between various motorcycle legislation (such as the introduction of Compulsory Basic Training) and the fatality rate. The second is to use data from the National Travel Survey to estimate rates relative to road usage rather than by population.
Data Notes.
The mid-year population estimates have been extracted from NOMIS. Some modelling was required to estimate population counts in 1979 and 1980. Moreover, some of the older data only has quinary data at the local authority level, which will require some modelling in order to impute values when extending this work to smaller geographical areas.
The publicly released data on data.gov.uk does not have individual ages for the oldest data. It has been possible to obtain individual ages from the data held in the Data Archive at Essex University from 1985, but Sprague polynomials have been used to estimate the individual ages prior to this date.
Share on: