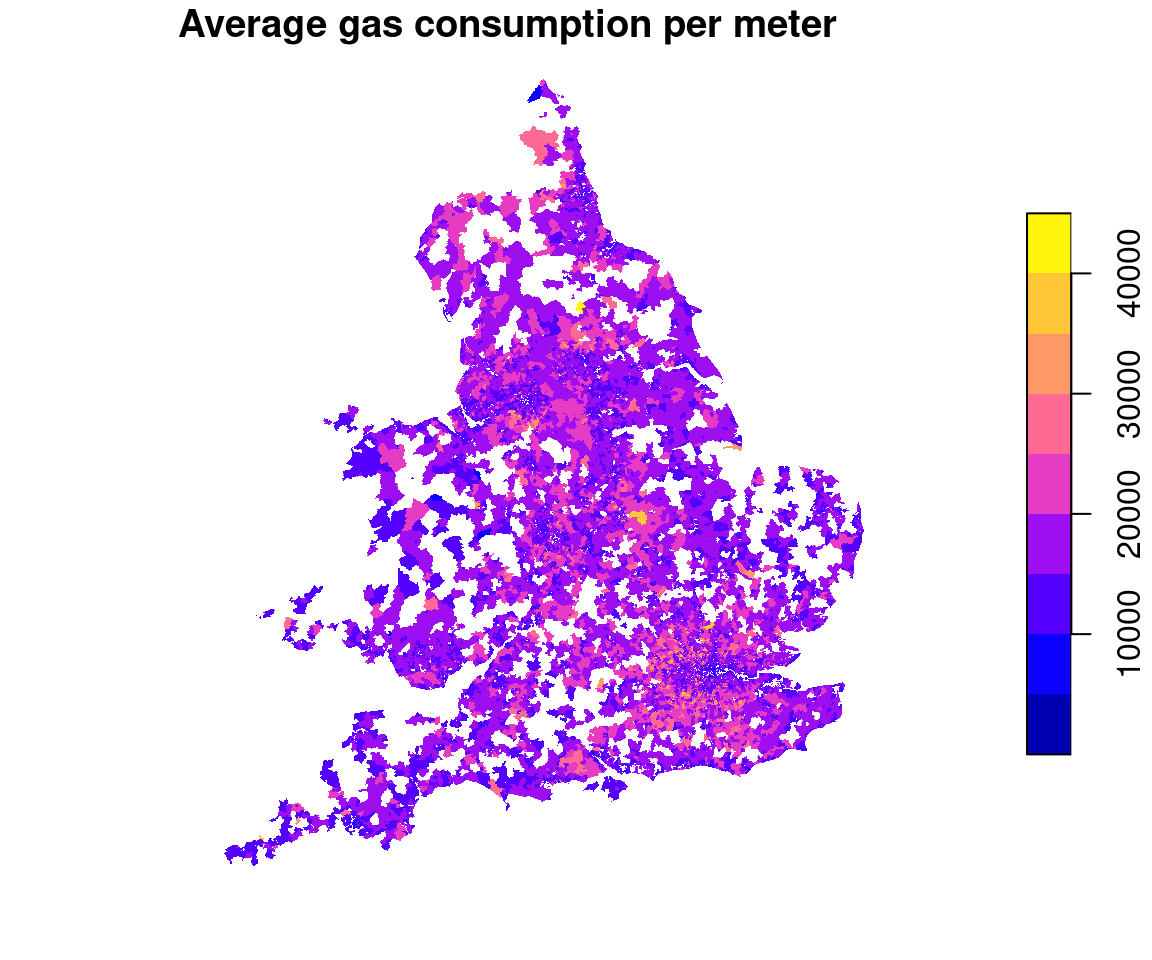
For several reasons, I thought it was worth looking in more detail at gas usage. Firstly, there is no way of reducing the carbon footprint of gas. When thinking about electricity, we could all keep our consumption the same, and rely on the generators moving over to carbon free ways of generating electricity. This doesn’t apply to gas consumption.
To start with, a map of gas usage recorded by LSOA.
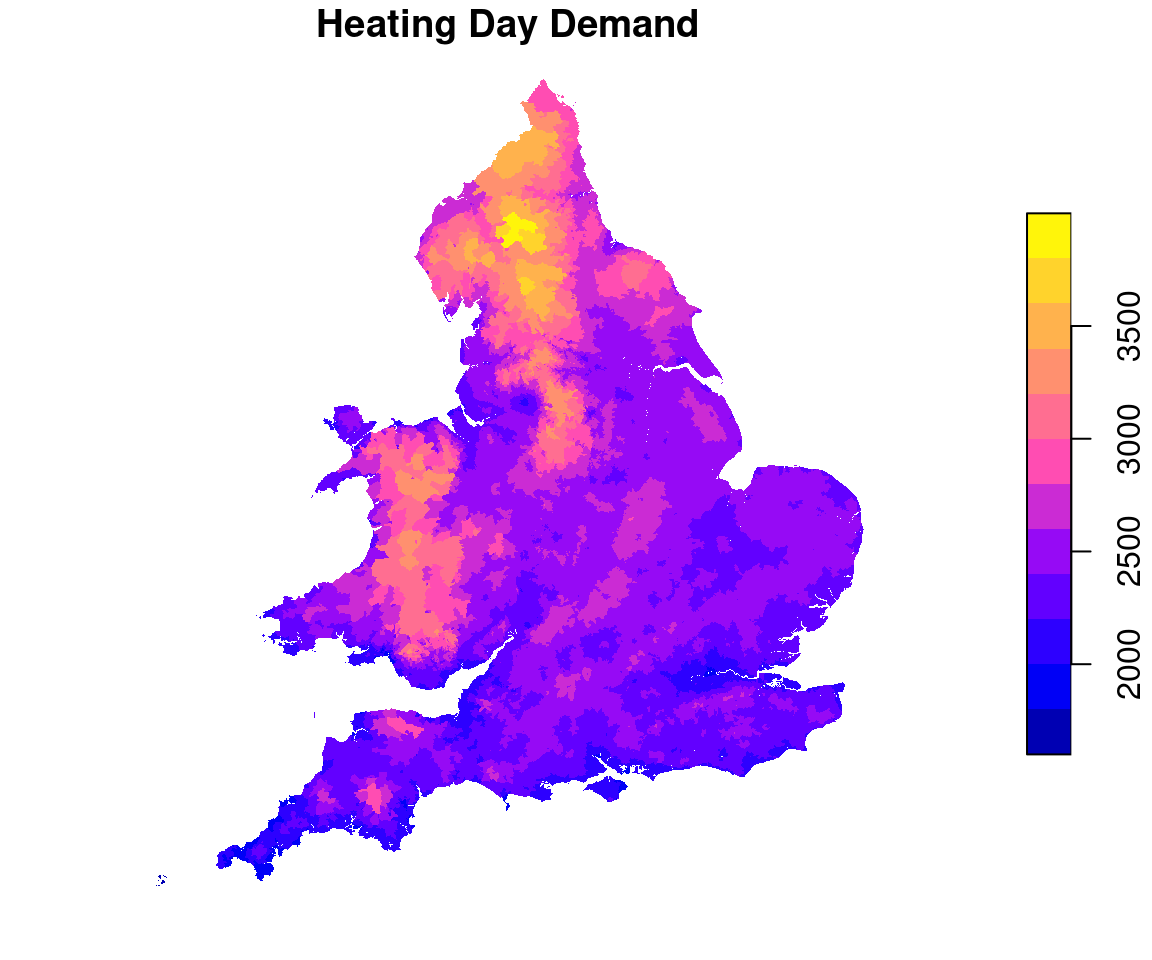
In order to understand which authorities are succesful in lowering the carbon footprint of their citizens, there are some contextual variables which seem relevant. The first that can be considered is the Heating Days Demand. This is defined as the sum of (18 - t) for all days d where the average temperature t falls below 15 degrees celsius. These data have been obtained from the Hadley Centre via CEDA in form of a 1km raster grid of min and max temperatures. These have been geoconverted by area to an “average” minimum and maximum daily temperature for each LSOA. Then, as an approximation to average temperature the mid point between minimum and maximum temperature was taken and the heating days demand calculated for each LSOA.
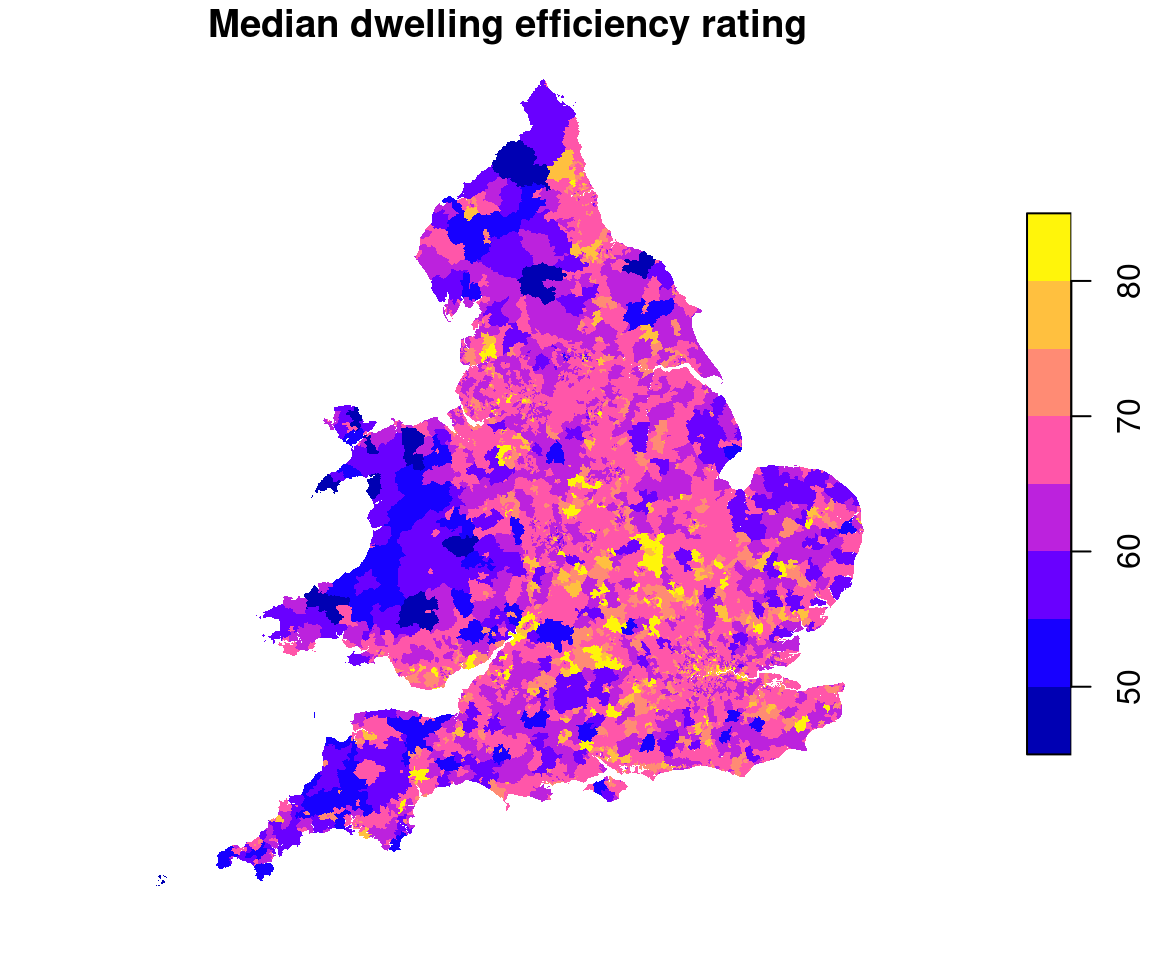
Secondly, we have some information on energy efficiency of dwellings. This is very crude, and only available aggregated to MSOA as a median energy score per MSOA. There is some further breakdown into new and existing dwellings as well as a split into houses and flats/maisonettes. Some data exists that may help to quantify the number of new and existing dwellings in each MSOA, but as all we have is a median it’s difficult to know what it means that the median new house has an energy rating of \(x\) if we don’t know how many new houses there are in an MSOA. This will require some further attention.
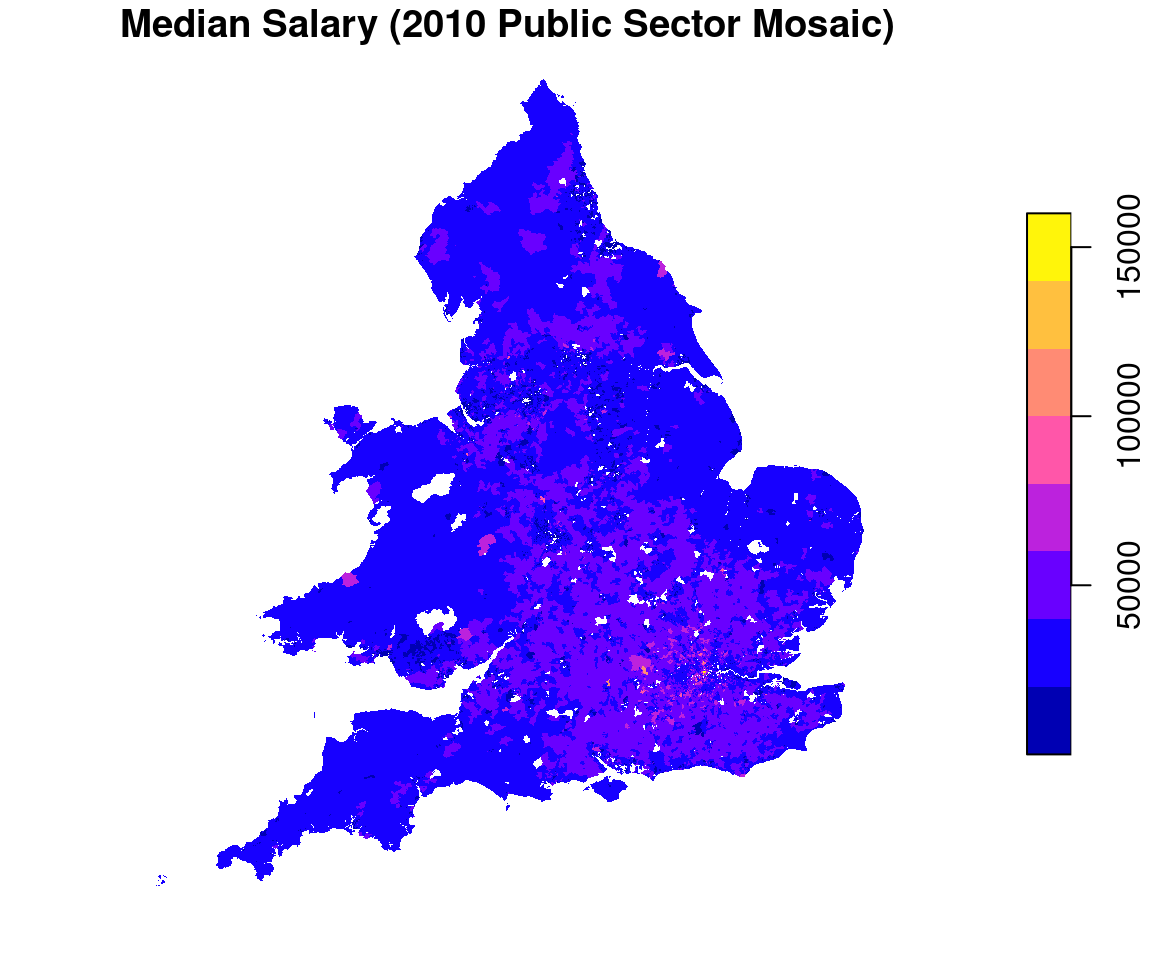
Finally, using some data from Public Sector Experian, we have median salary by LSOA from 2010.
If we wish to determine which local authorities are doing the most to reduce carbon footprints, we can fit models to estimate the effect of contextual variables. If residents in areas with a higher median salary burn more gas there is little the local authority can do in the short term to directly affect median salary. If residents living in colder parts of the country use more gas, there is nothing the local authority can directly do to influence that. However, they can work on improving the energy efficiency of housing stock in their area. Maybe there should be local or regional standards for energy efficiency based on the HDD.
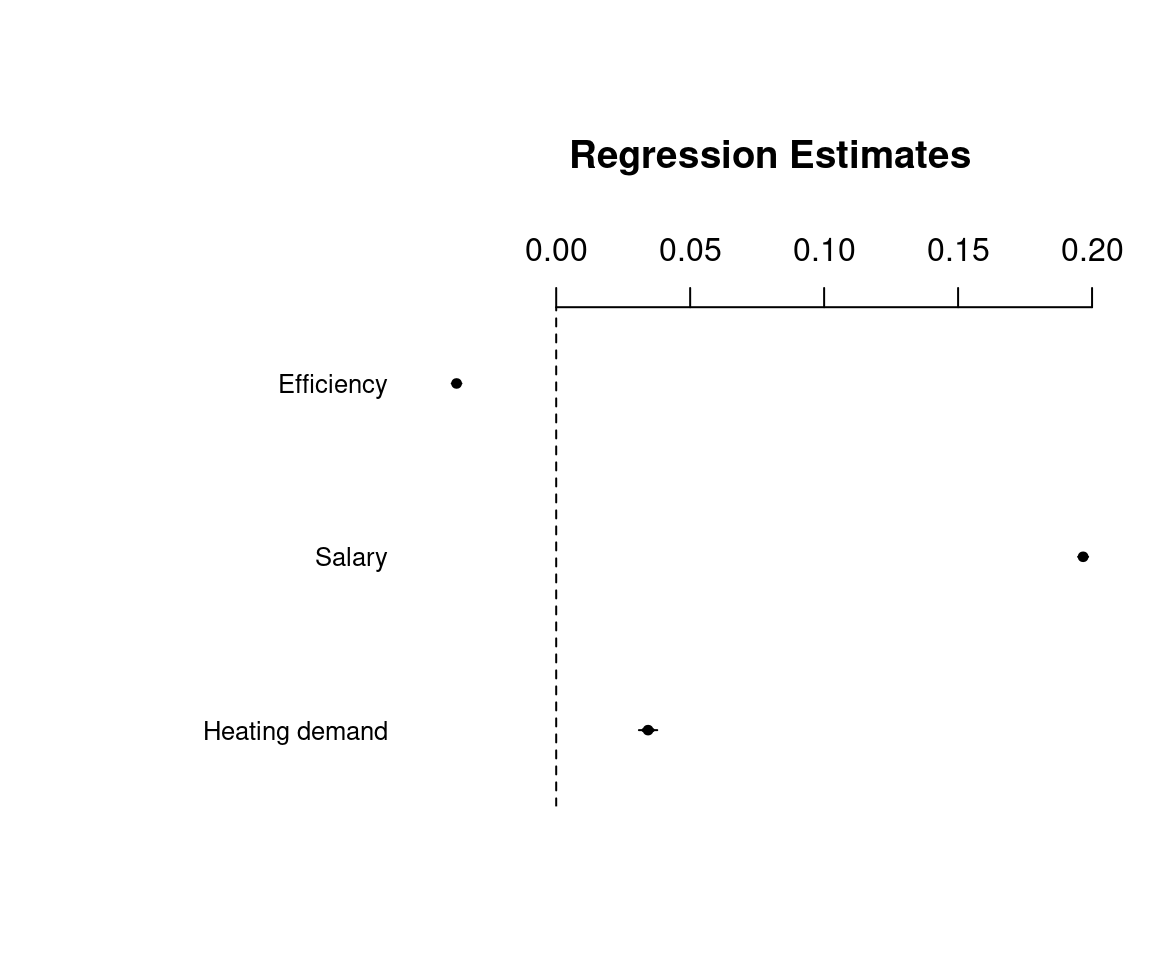
One model fitted has been to assume that the total gas consumption follows a gamma distribution with an offset of the number of gas meters (effectively modelling the average consumption per meter). There is a random intercept with a term for each local authority and “standard” fixed predictors for heating days demand, median salary and median efficiency. A sketch of the coefficient estimates is given above. This model does indeed confirm that gas consumption is positively associated with salary and heating days demand, and negatively associated with the median energy efficiency rating of housing stock. Having taken this into account, we can see the 20 local authorities with the largest gas usage (conditional on allowing for median salary, median efficiency and heating days demand).
| Authorities |
|---|
| Mansfield |
| Merthyr Tydfil |
| Blaenau Gwent |
| Neath Port Talbot |
| Leicester |
| Swansea |
| Caerphilly |
| Sunderland |
| Blackburn with Darwen |
| Wirral |
| Doncaster |
| Ashfield |
| Rhondda Cynon Taf |
| Manchester |
| Sefton |
| Wolverhampton |
| Blackpool |
| Bradford |
| Southend-on-Sea |
| East Lindsey |
Use the share button below if you liked it.
It makes me smile, when I see it.