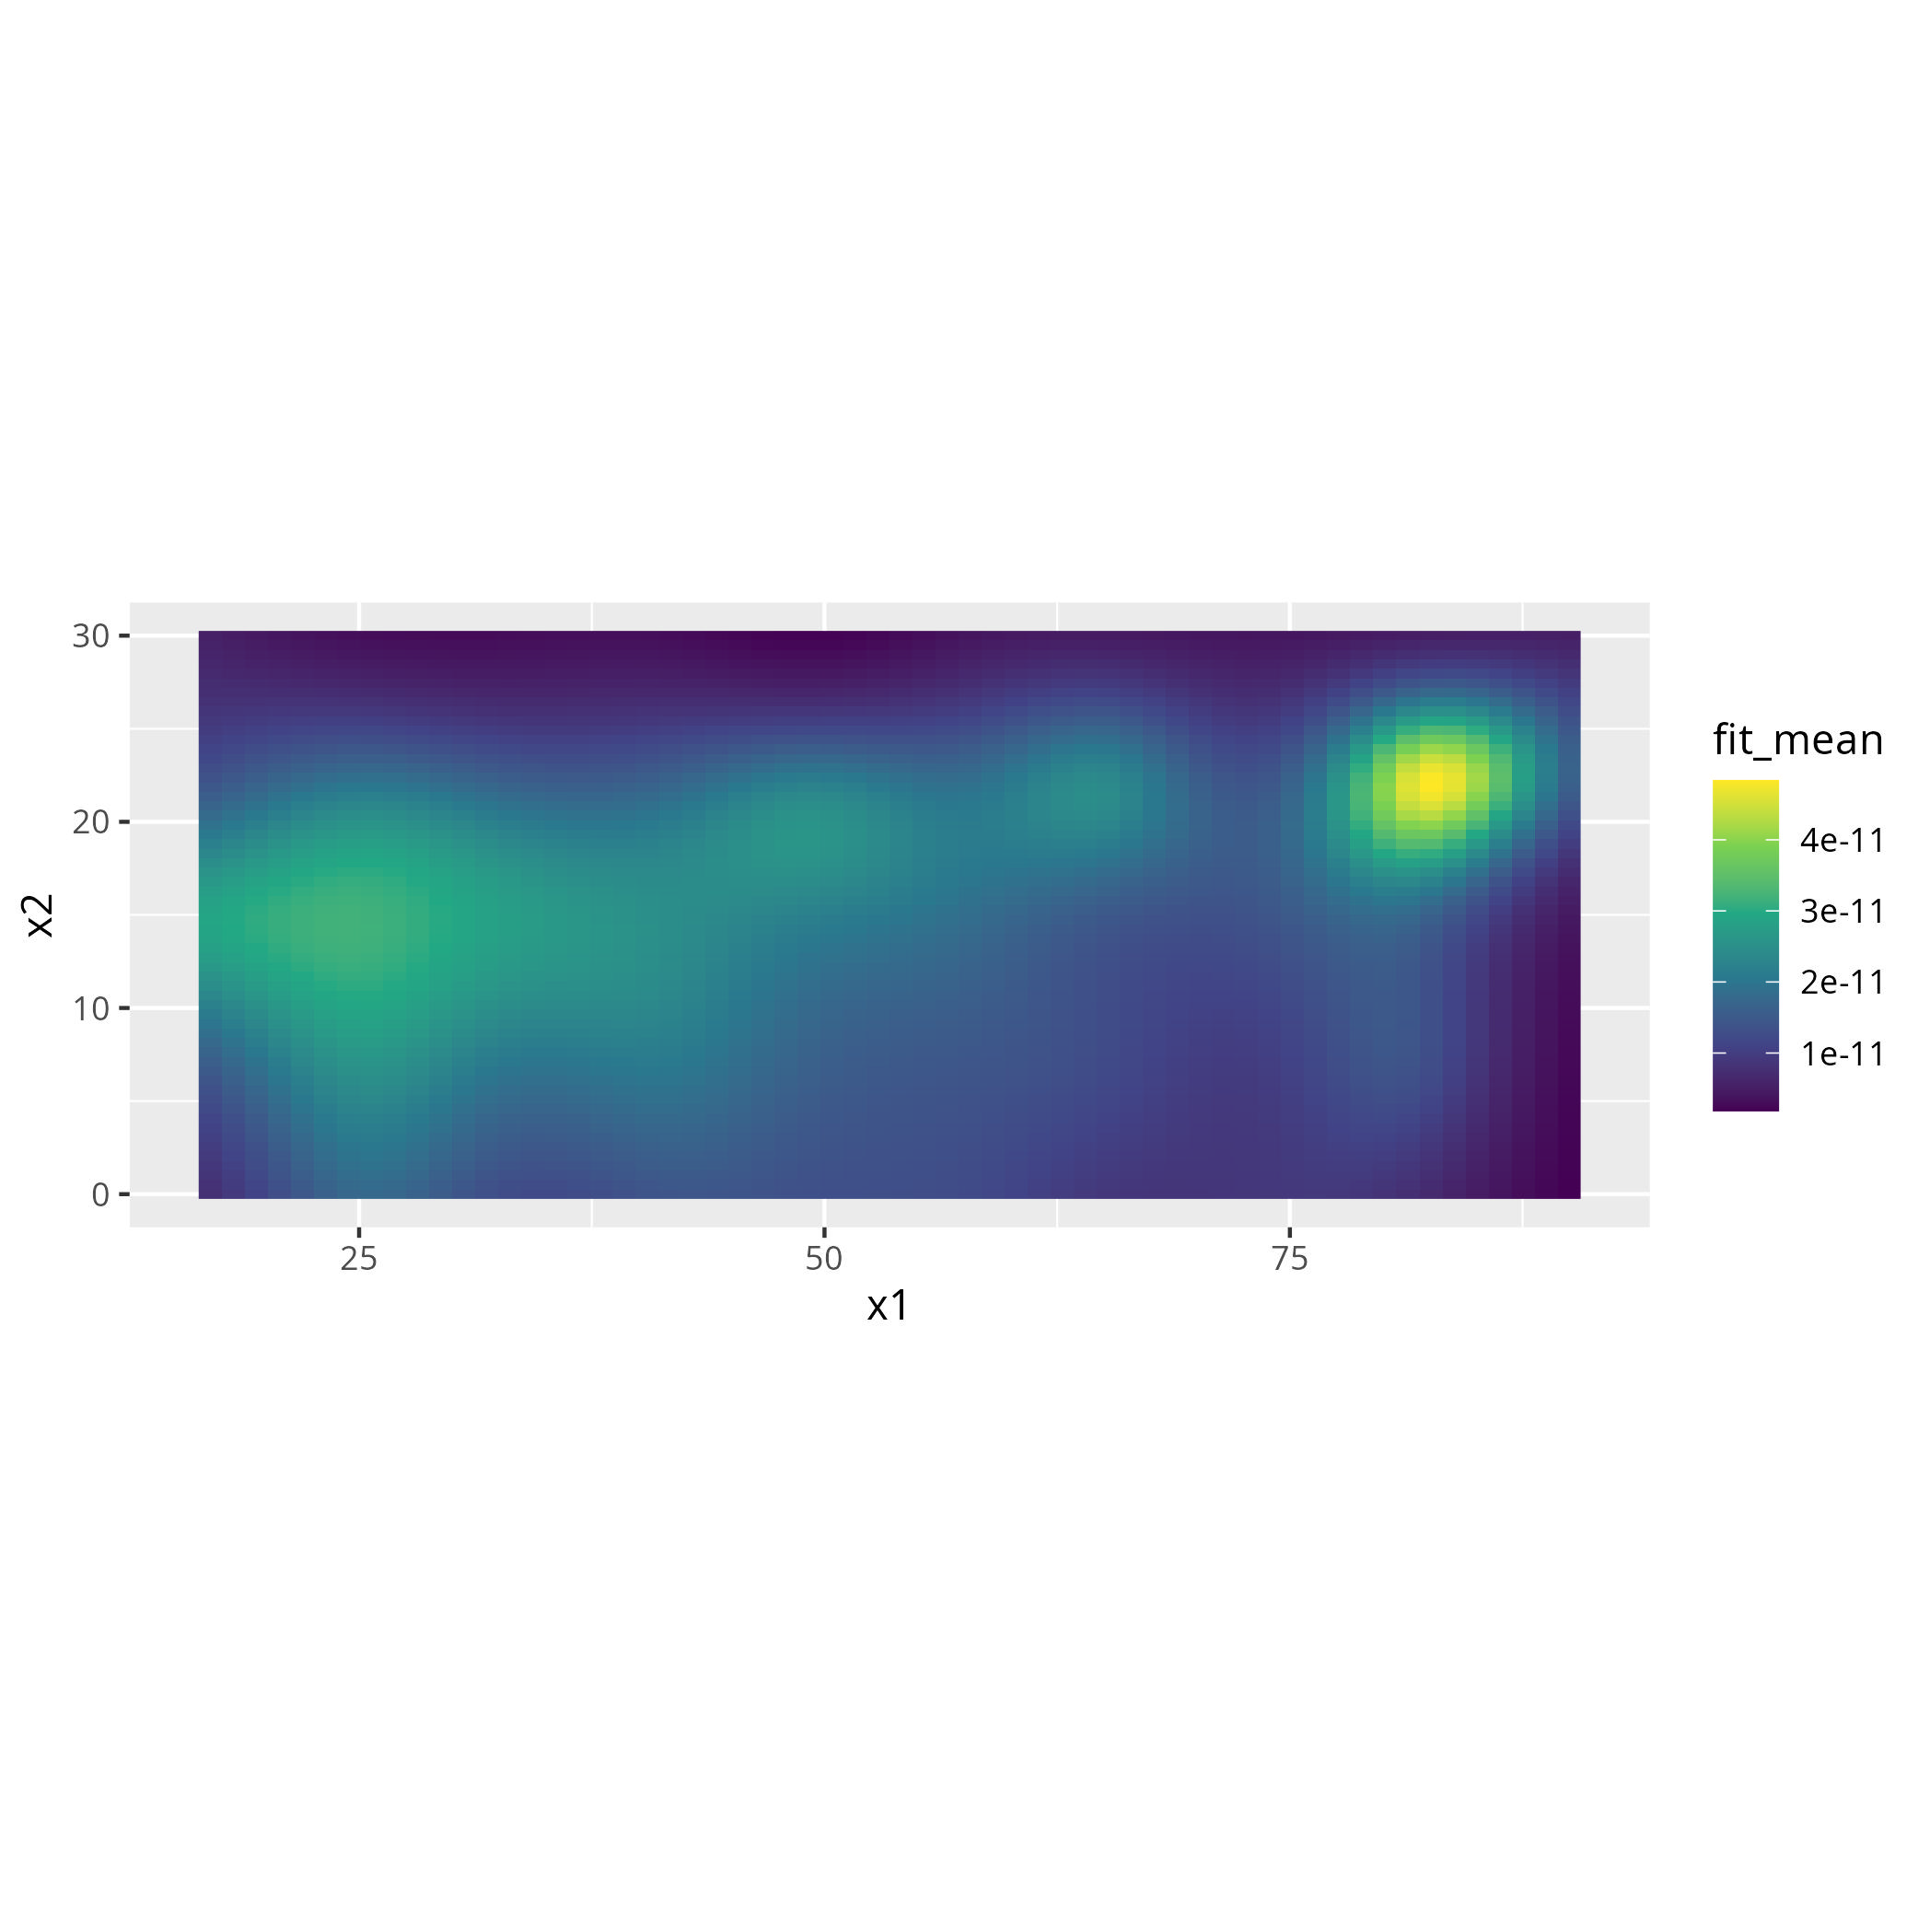
 Simple model fitted to complete case analysis (any row with missing data deleted)
rstan on nix(rix)
So I’m trying to fit splines using stan. That’s easy enough except of course these days I’m using nix(rix) for dependency control which made installation a faff. Hopefully this will mean something one day, I had to run
nix-prefetch-url --unpack https://github.com/stan-dev/cmdstanr/archive/refs/tags/v0.9.0.tar.gz
to get the sha256 so that I could bash install cmdstan under nix.
Data on dvc
The other change is that I’ve finally got round to updating some of the data I needed (I’m using dvc as well so hopefully much easier going forward). This even includes running a few test queries against the published RCGB results so that I can check the database is correctly loaded and matches the DfT published results.
Splines
So now I actually get to do the interesting stuff. To cut a long story short, I’m trying to model the crash count (eventually it will be the rate) based on a model which among other things includes a 2d spline for driver age and vehicle age.
The basic model is something like
[ y_i = Poisson(\mbox{offset_i} \lambda_i) ]
And we have that [ \log(\lambda_i) = \alpha + \boldsymbol{B}_i \boldsymbol{\beta} ]
Now, we first have to address a database neatness thing. When I query the database, it only returns rows where this is a non-zero count. I could probably fix this by a query amendment, but I went with this instead:
grid <- expand_grid(
  age = 17:99,
  age_of_vehicle    = 0:96
)

df <- grid %>%
   left_join(drivers, by = c("age","age_of_vehicle")) %>%
   mutate(y = coalesce(y, 0L)) %>%
   mutate(y = as.numeric(y))
So I create a grid of all possible values of age and age_of_vehicle, and then left join the non-zero values obtained from the database, and fill the blanks with 0. It is important to note that, according to stats19 there were injury collisions involving vehicles up to 96 years old. Nevertheless, from 2015 to 2024 I have about 35 collisions involving cars 30 years or older (out of slightly over 28,000 collisions. In other words, we’re talking about around 0.125% of crashes with car_age > 30 which is sparse and this is going to be a nuisance for a 2d spline.
Cap the age of cars
One idea is to cap the age of cars at 30 (or maybe slightly lower) and have a binary indicator for cars over 30.
df_tc <- df %>%
  mutate(x2_clip = pmin(x2, 30L), over30 = as.integer(x2 > 30L))
sm <- twod_spline(dat_tc %>% rename(x2 = x2_clip), k1 = 10, k2 = 8)
Now, using a “standard” implementation (the spline is created in R and the function/matrices passed to stan means a closer look at the penalties. Using a strong penalty means first summing all penalty components and then adding a tiny ridge
Kmat <- Reduce(`+`, sm$S)
Kmat <- Kmat + diag(1e-6, ncol(Kmat))
This means adding data array[N] int<lower=0,upper=1> over30; and a parameter real gamma_over30 which I allocated a prior of gamma_over30 ~ normal(0, 0.5);
This works, and gives plausible looking results. The problem is I really want to account for the uncertainty which arises from the fact we don’t always know driver’s ages or the vehicle’s age.
Missing data problem
Now, in theory what I’m doing is quite straightforward:
[ p(\beta|y) = \int p(\beta | y, x_{\mbox{miss}}) p(x_{\mbox{miss}}|y)dx ]
which essentially propagates uncertainty into the spline surface. However, this “missing data” problem is more complex than many textbooks want to deal with, because we’re not just missing a few entries in our data table. It’s the raw data where we are missing data, so we can’t aggregate nicely.
- If we don’t know the vehicle age, we don’t know what offset to apply (number of vehicles of that age, miles travelled by vehicles of that age)
- It’s the same for driver age; what’s the relevant number of drivers of unknown age? Or estimated number of trips.
Essentially, we have some crash involved drivers, and don’t know which rows to add them to. Somewhere along the say, I ended up building the spline function in stan with some hand coding. This means I need to assign a prior to my missing data. I’m not really sure I needed to. Anyway, here are some working notes. A 2d tensor spline is:
[ f(x_1, x_2) = \sum_{j=1}^{k_1} \sum_{l=1}^{k_2} \beta_{jl} B_j^{(1)}(x_1) B_l^{(2)}(x_2) ]
or in matrix form
[ f = (B_1 \kron \B_2) \beta ]
Where $B_1$ is the basis for $x_1$ and $B_2$ is the basis for $x_2$
A detail, tensor splines use separate penalties for each margin
[ \lambda_1 \beta^T(S_1 \kron I) \beta - \lambda_2 \beta^T(I \kron S_2)\beta ]
Marginalising over the missing data
So, let’s look at the data
| y[1] | driver_age[i] | vehicle_age[i] |
|---|---|---|
| 10 | 30 | 5 |
| 30 | NA (0) | 4 |
| 7 | 45 | NA (0) |
| 15 | NA (0) | NA (0) |
Now, my offset is known for all cells, what’s not known is which cell rows 2, 3, 4 apply to.
I think this means I want to model something like the following. Define:
[ \mu_{a, v} \mbox{Offset}{a,v} \lambda{a, v} ]
Then when I have no “missing data”:
[ y_{a,v} = Poisson(\mu_{a, v}) ]
When I’m “missing” one of the ages:
[ y_{a,\cdot} = Poisson(\sum_v \mu_{a, v}) ]
the opposite if $a$ is missing. If both are missing then
[ y_{\cdot,\cdot} = Poisson(\sum_{a,v} \mu_{a, v}) ]
In code, this looks something like:
mu_surface[a, v] = exp(log_pop[a, v] + eta_surface[a, v])
So, for the fully known case, with $y=10$, mu_surface[30, 5] = exp(log_pop[30, 5] + eta_surface[30, 5]). However, if I have $y[i] = 30$ for a row where the driver age is missing but we know the vehicle age instead I need to find
mu_sum = sum(mu_surface[1:90, 6])
and will have a likelihood of $y \sim Poisson(exp(mu_sum))$
So at the moment, I have a likelihood in stan that looks like this:
for (i in 1:N) {
  int a = driver_age[i];
  int v = vehicle_age[i];
  real mu_sum;

  // Case 1: both observed
  if (a > 0 && v > 0) {
    target += poisson_log_lpmf(y[i] | log(mu_surface[a,v]));

  // Case 2: driver missing
  } else if (a == 0 && v > 0) {
    mu_sum = 0;
    for (aa in 1:A1)
      mu_sum += mu_surface[aa, v];
    target += poisson_lpmf(y[i] | mu_sum);

  // Case 3: vehicle missing
  } else if (a > 0 && v == 0) {
    mu_sum = 0;
    for (vv in 1:A2)
      mu_sum += mu_surface[a, vv];
    target += poisson_lpmf(y[i] | mu_sum);

  // Case 4: both missing
  } else {
    mu_sum = 0;
    for (aa in 1:A1)
      for (vv in 1:A2)
        mu_sum += mu_surface[aa, vv];
    target += poisson_lpmf(y[i] | mu_sum);
  }
}
In other words, if we don’t know which age cell contributed the crashes, we just say that the espected crashes equal total expected crashes across all categories. This relies on Poisson additivity. I think this makes sense, and propogates some uncertainty into the 2d spline.
Marginal posterior for the splines
I think I can extract the smooth function from stan as follows:
spline_draw <- eta_draw - alpha_draw
marg_driver <- rowMeans(spline_draw)
marg_vehicle <- colMeans(spline_draw)
which should mean that the marginal splines look like:
n_draws <- length(alpha_draws)
marg_driver_post <- array(NA, dim = c(n_draws, A1))
marg_vehicle_post <- array(NA, dim = c(n_draws, A2))

for (i in 1:n_draws) {
  spline_draw <- eta_surface_draws[i,,] - alpha_draws[i]
  marg_driver_post[i,] <- rowMeans(spline_draw)
  marg_vehicle_post[i,] <- colMeans(spline_draw)
}

# Summarize with mean, median, 95% CI
driver_mean <- apply(marg_driver_post, 2, mean)
driver_lower <- apply(marg_driver_post, 2, quantile, 0.025)
driver_upper <- apply(marg_driver_post, 2, quantile, 0.975)

vehicle_mean <- apply(marg_vehicle_post, 2, mean)
vehicle_lower <- apply(marg_vehicle_post, 2, quantile, 0.025)
vehicle_upper <- apply(marg_vehicle_post, 2, quantile, 0.975)
Use the share button below if you liked it.
It makes me smile, when I see it.