 Paul Hewson
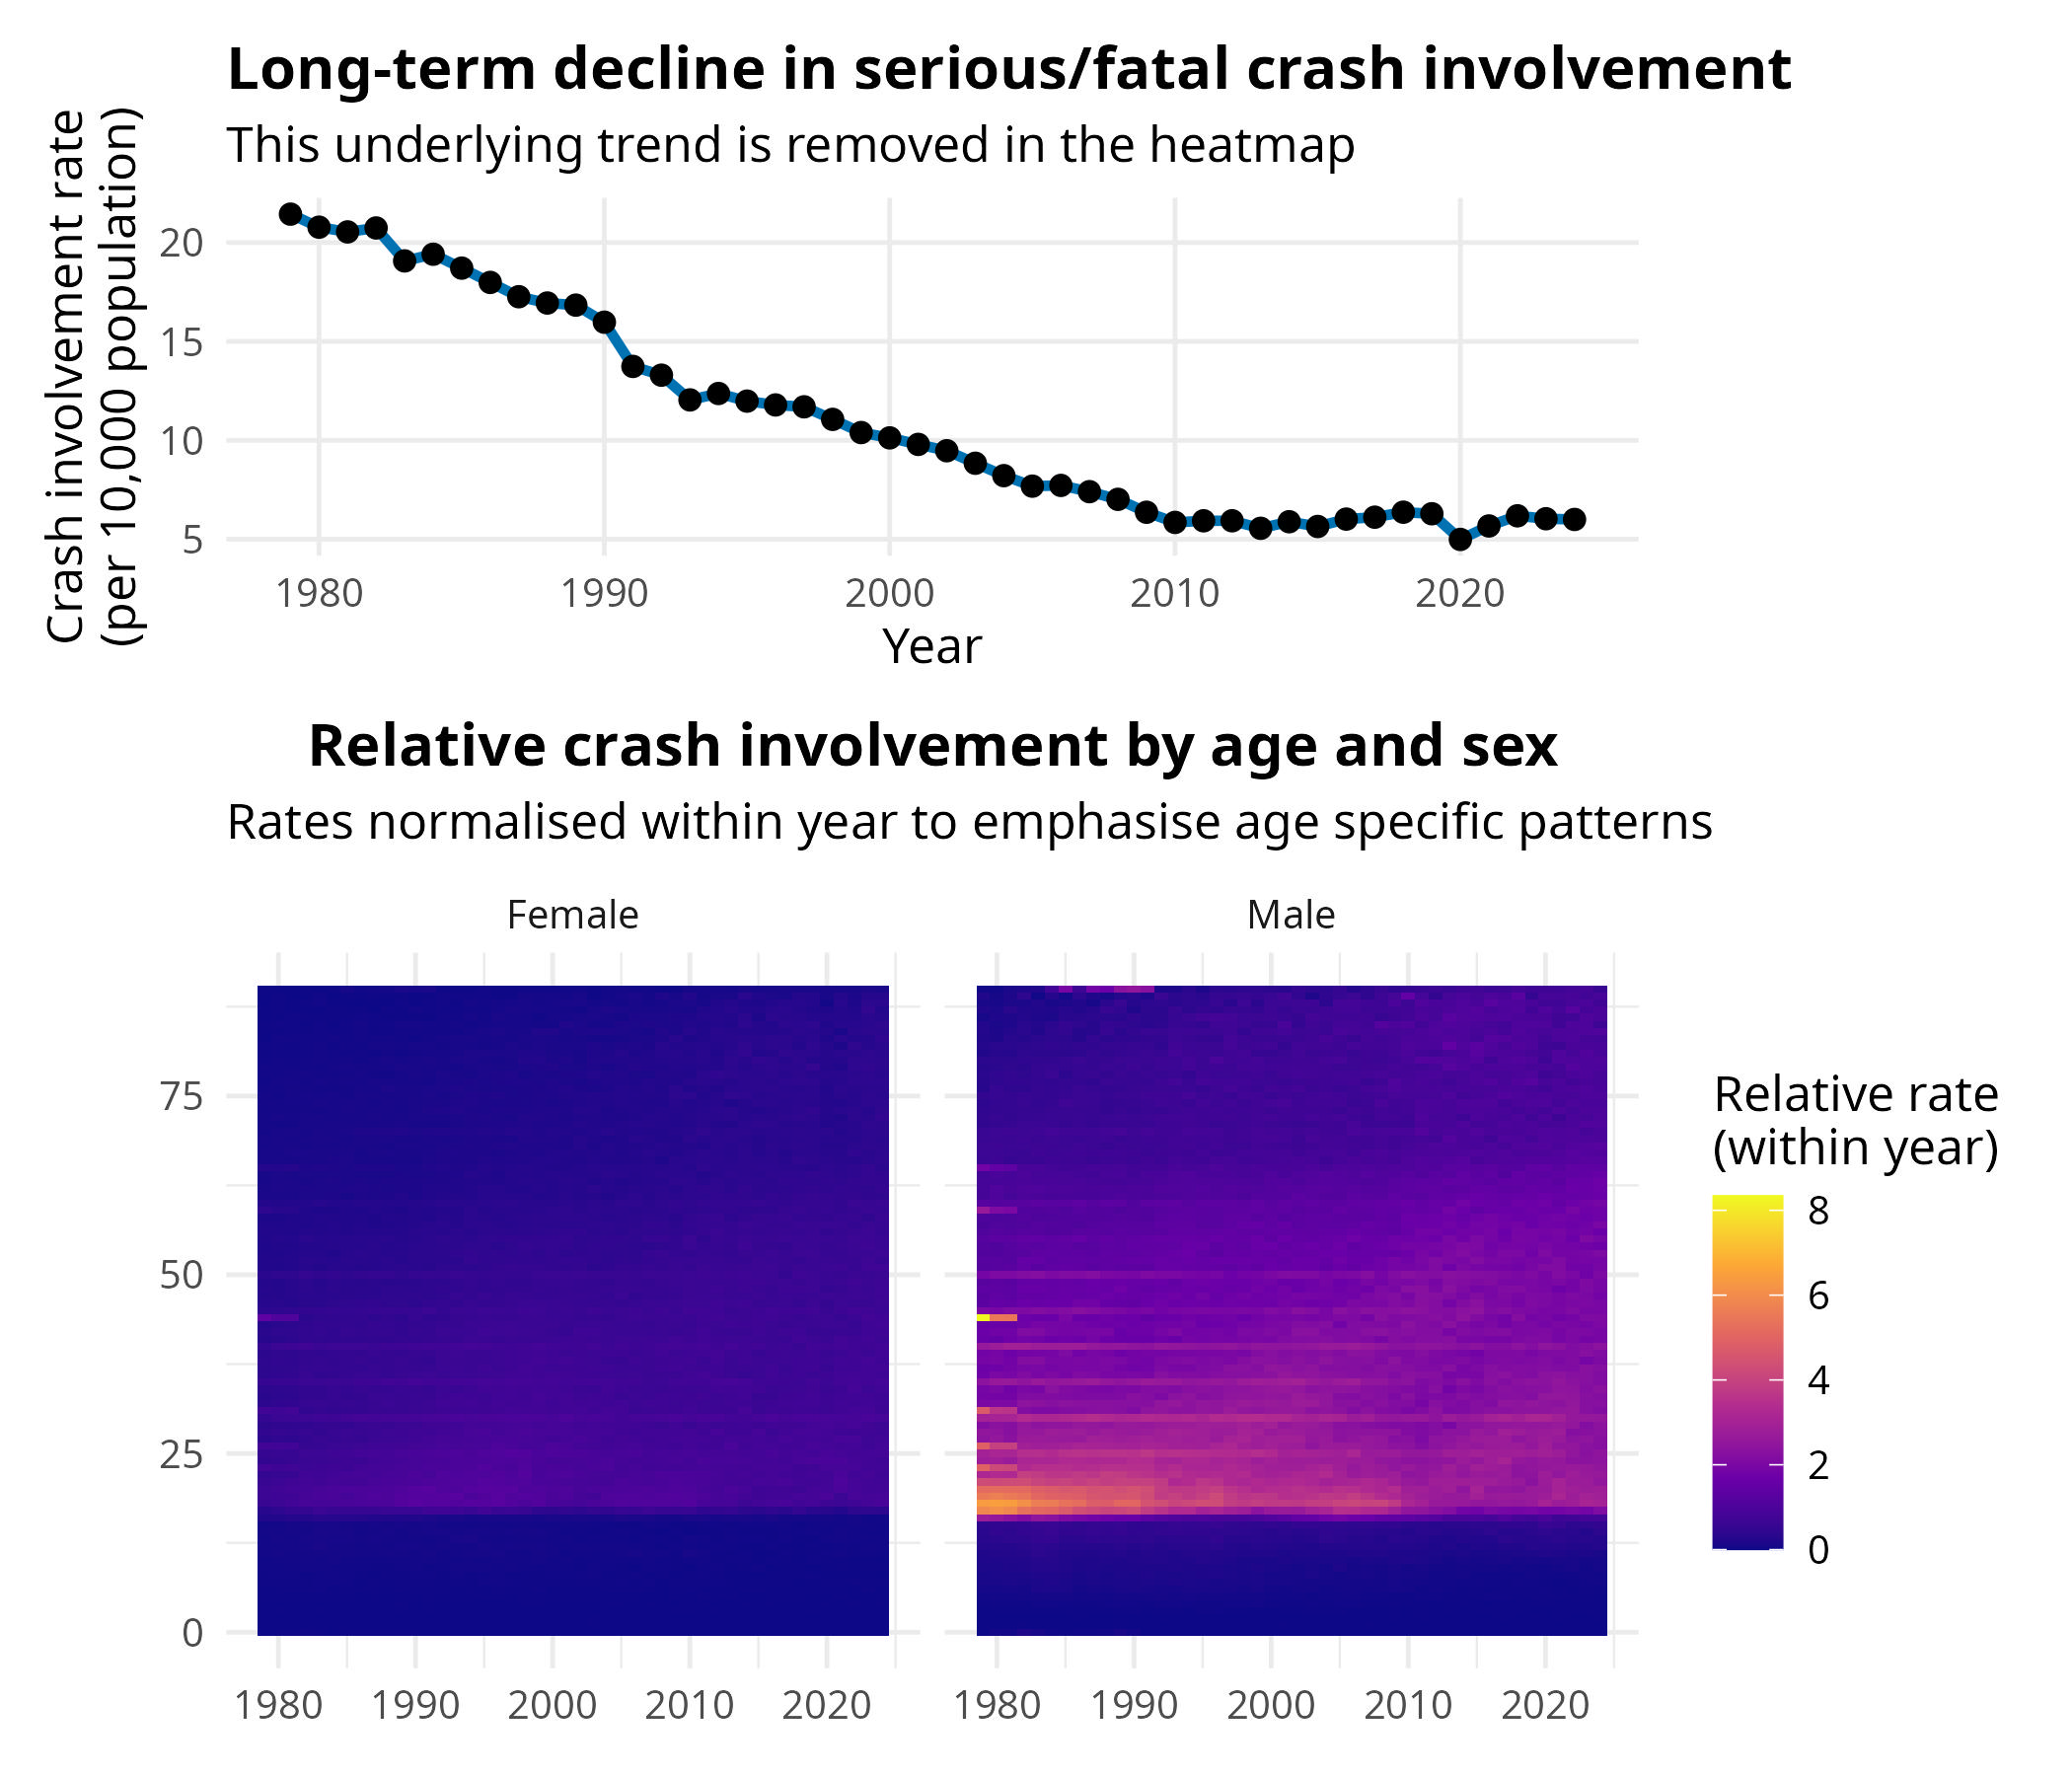
I’ve been working with Lexis diagrams of GB road casualty data again. I thought I’d be really clever and de-trend them. The problem with UK data is that 1979 was such a bad year that you can’t see much patterns other than the huge number of young people injured in the late 70s early 80s. I’ve tried taking logs of the crash rate, but that (a) doesn’t help cosmetically (I think it’s an over-correction) and (b) it’s really hard to explain what you’ve done to a lot of people who would be interested otherwise. So I thought I’d be really clever and detrend the plot, essentially calculating a relative rate for each year, so we can see the patterns.
Anyway, this is how I estimated the smoothed relative rate. I think it’s correct.
df2 <- df |>
  filter(year >= 1979) |>
  mutate(rate = 10000 * y / pop) |>
  group_by(year) |>
  mutate(global_rate = weighted.mean(rate, w = pop, na.rm = TRUE),
         rel_rate = rate / global_rate) |>
  ungroup()
I thought about using some splines:
library(splines)

df2 <- df |>
  filter(year >= 1979) |>
  mutate(rate = 10000 * y / pop) |>
  group_by(year) |>
  mutate(global_rate = weighted.mean(rate, w = pop)) |>
  ungroup() |>
  mutate(smoothed_global = predict(smooth.spline(year, global_rate)),
         rel_rate = rate / smoothed_global)
Anyway, you can see the problem I’ve got now. Where do those big horizontal bars every five years come from.
The 2024 STATS20 guidance states that certain variables must be recorded exactly as provided by the road user, particularly age-related data. Source: STATS20 Instructions for the Completion of Road Collision Reports – 2024 edition
STATS20 contains no indication of:
- rounding driver ages to 5‑ or 10‑year intervals
- estimating driver ages
- permitting “best guess” ages
- using age categories for recording
Police officers are required to enter the numeric age, based on either:
- what the driver says, or
- what is written on a driving licence or other ID.
Thus: age should not be grouped by design.
We could get a bit of heaping. Maybe people round their own age when speaking (I’m 30, not I’m 29 or 31). Maybe there’s something that codes missing ages. Or maybe CRASH is generating some artefacts for some areas (if you enter year of birth and year of crash only you get a different age than if you put in the entire D.o.B. and full date)
I’ll add some plots in, but I can’t see strong evidence for age heaping, which makes this even more intriguing. Maybe I should do a Benford type thing to see if there are too many ages ending in 0 and/or 5?
I do know that using a relative‑rate Lexis diagram:
- remove a strong secular downward trend
- divide by a global rate
- emphasise residual differences
- inflate contrast in small structures
So even very small cohort coherence appears as stripes.
I think the chart is interesting, I just need to figure out where these horizontal stripes are coming from.
Use the share button below if you liked it.
It makes me smile, when I see it.